Lightning Analytics: More Than Just Telematics
Our battery-electric vans, trucks and buses run on the best drivetrain components available, for reliability, efficiency and longevity. However, we go beyond the hardware with our Lightning Analytics technology. Every vehicle is equipped with a telematics controller which interfaces with the CAN bus and connects to our data servers over an encrypted 4G connection. This allows Lightning Systems to monitor the health of every EV; but it also forms the basis of the valuable Lightning Analytics service for our customers.
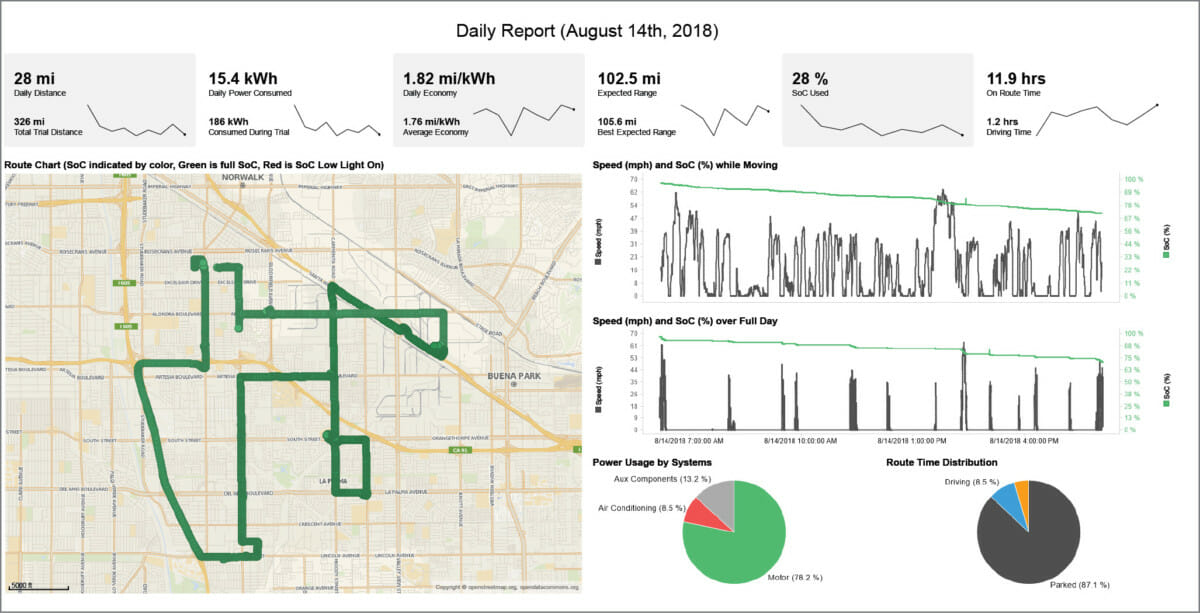
Lightning Analytics goes much deeper than many commercial telematics solutions. By reporting GPS location and as many as 70 vehicle parameters every second, a rich set of data on every vehicle’s activities is collected. Using sophisticated analysis tools, we generate reports for our customers. Here is an example of a daily report for a single vehicle:

This report shows the following information:
- Along the top, there are at-a-glance metrics for miles driven, power consumed, economy (miles per kWh, which you can think of as the BEV version of miles per gallon), expected range, State of Charge used, and time spent on the route.
- The map on the left shows the vehicle’s route. If the batteries’ state of charge gets low, the route line turns red.
- On the right, there are two versions of the “speed and state of charge” graph; the lower one includes the times where the vehicle was parked; the upper one doesn’t. The green line shows the state of charge in the batteries. Usually, this slopes down to the right; but two things can make it bump up again: charging the vehicle, and “regen” events, which are braking events that charge the batteries a little.
- The left-hand pie-chart shows where the electrical power went. In this case, the motor used most of it, as expected, with air conditioning and auxiliary components accounting for about 22% of the energy used.
- The right-hand pie-chart shows how much time was spent parked or driving during the route.
We also generate reports which summarize the metrics across an entire fleet.
There’s a lot more data available, which means that we can customize the reports or generate specific types of analysis to help customers understand things like route optimization and driver behavior.
As an example, one of our customers was interested in how our Ford Transit vans behave in hilly locations. The report below adds altitude data which reveals multiple regen events on downhill sections. Wherever the orange altitude line slopes downwards, the green state of charge line rises slightly. This shows that when the driver takes his foot off the accelerator pedal, the electric motor becomes a generator, which extends the vehicle’s range. The rising green slope shows the time spent in the morning charging the vehicle.

This is just one example demonstrating the power of Lightning Analytics. Telematics solutions from other vendors would not be able to perform this type of analysis, due to their lower data resolution.
Lightning Analytics is a powerful tool for gaining insight into almost every aspect of a vehicle’s operation and performance. Fleet managers can take advantage of it to optimize routes, train drivers and capture the best value from their fleet of Lightning Systems EVs. Lightning Systems’ analytics experts are available for custom reporting, custom data analysis and interpretation, and training.